


I'm about to finish my master's degree so I need to make up my mind to choose a place to settle down. Boston, where I live right now, is a great city but not only are housing prices skyrocketing but also according to Investopedia "Groceries and health care cost a lot of money in Boston, exceeding the average national cost by more than 20%". Cost aside, I'm also not a fan of the cold weather of New England. Here, even in the summer, it gets so cold that I sometimes need to wear a coat when I go outside.
Considering that I came to the United States three years ago I don't have enough knowledge and experience to determine which state or city would be the most suitable for me and my family to live in. Fortunately, in the past year, I've been studying data science so I decided to use my data engineering and analysis skills to find my next home. Let's break down the problem.
What does my favorite city look like?
Before making any attempts to gather data, the fundamental question to answer is: "What are the characteristics of the best place for my family to live?" After reflecting on the factors that will be important to me and my family in our next home, here are the realizations I had that ultimately guided my analysis
- I want to be able to buy a 3-bed room house for around $350,000
- I want to be able to find a job as a software developer/data scientist
- City crime rate, especially violent crimes, should be less than the national average (372 instances per 100,000 population)
- I want to live in an area where the majority of people support the Democratic Party
- I want to live in a diverse community, with all types of demographics represented
- The city I choose should have high ranking schools at all levels of education
- I prefer to live in a warm climate with minimal humidity
Having these detailed criteria it's easier to look for the place that will be the best fit for my next home.
How can I find the City?
This house hunting project is a typical data science problem. Fortunately, the essential part of making the decision, which is the data, is available on the Web. So, I just need to:
- Find the data sources with accurate and granular data
- Download or scrape the data
- Clean and normalize the data
- Create a user interface to conveniently feed my priorities and filters into the algorithm and check the results
- Last but not least, improve the process if possible
Housing Data
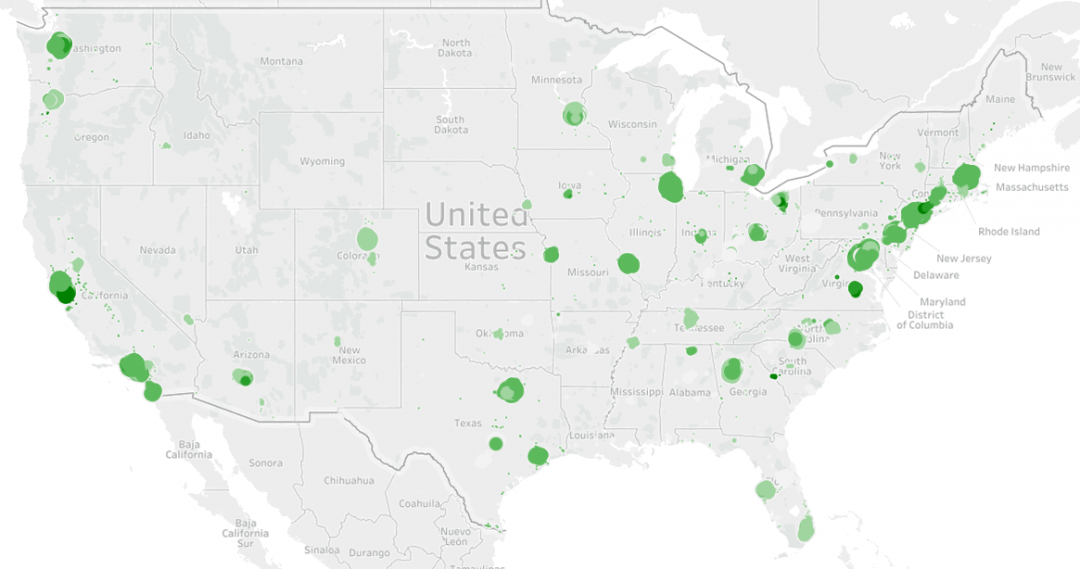
For housing data, I found Zillow Research Data very helpful. Several types of pricing are available on the Zillow website but I decided to use the 'Median Home Value Per Square fit' dataset to have more generalized results.
The housing price for 7197 cities across the United States dates back several years. I used the average of last 12 months to calculate the current price of one square foot in each city. This dataset is the cleanest data set that I worked on in this project there was nothing tricky that's worth mentioning here. The only issue is the coverage of the data, as the dataset comprises only 1193 out of 3007 counties in the US but as you can see below, there was enough data to see if the method works, at least for the first attempt.
Note: Alaska state is not shown
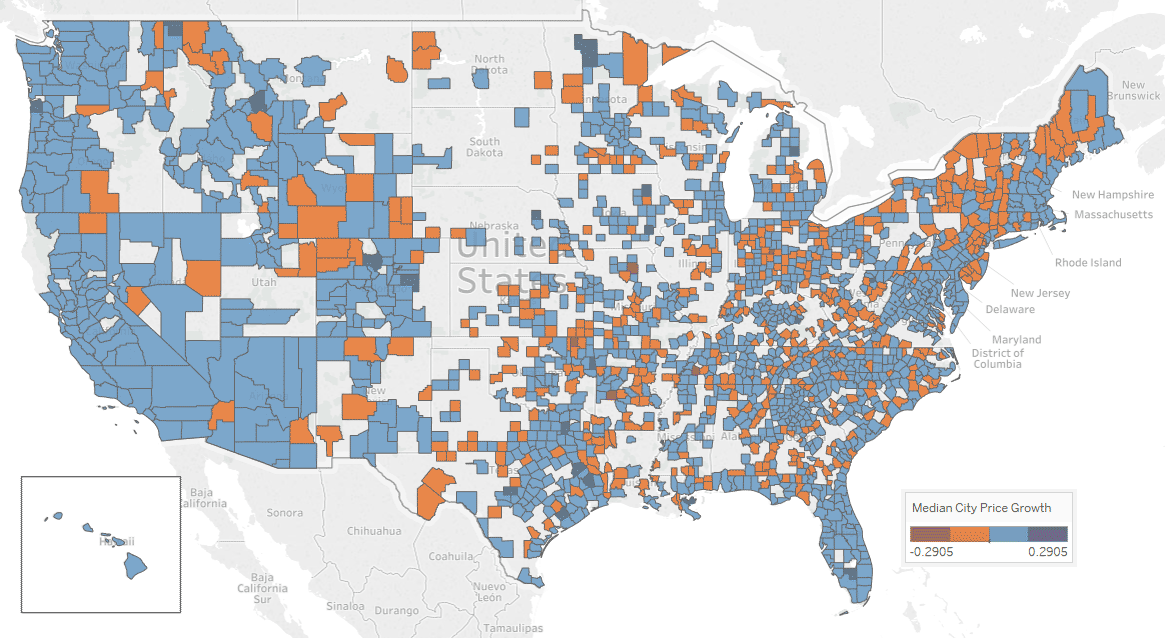
Update (06/07/2017):
Using Zillow dataset, I calculated CAGR (Compound Annual Growth Rate) over past two years. The city of Nowata in Oklahoma is on the top of cities with negative growth of -24% and the city of Oelwein in Iowa has growth the most in past to years by the rate of +29%. Here is the heat map of growth rate by county:
Job opportunities and school ranking data
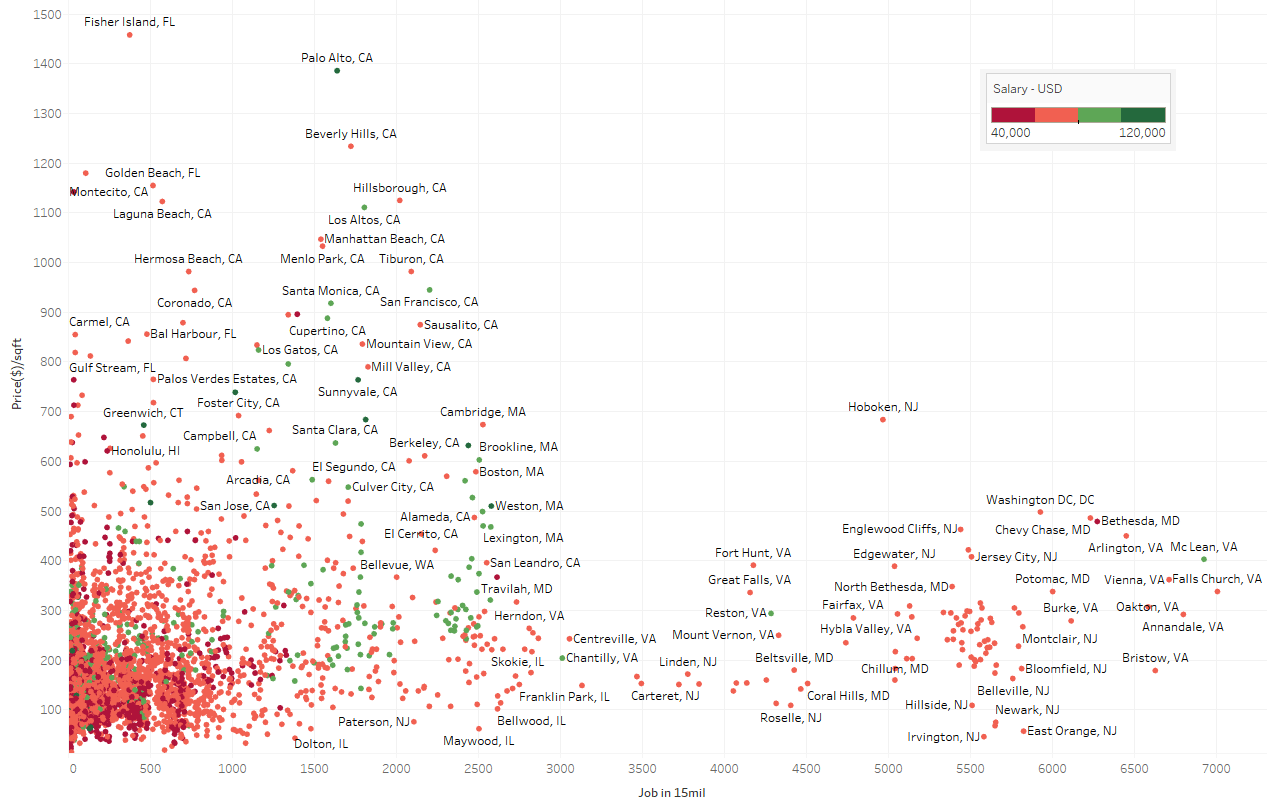
Finding data on the availability of jobs in thousands of cities is not easy. I couldn't find any API or dataset to be granular enough for my research so I ended up writing a web wrangler, using Python language, to send around 7,000 requests to a job hunting website to get the job number and salary of "full-time data analyst" in a 15-mile radius of each city. If you want to do the same thing, make sure you send proper HTTP requests and put enough delay between each request to make sure the server wouldn't block your IP. It took the script 7 hours to do complete the process. At this point looking at the scatter plot of house pricing and job opportunities might be interesting. To me, McLean, MD is the most interesting as it appeared bottom right with a salary of around $120,000 per year.
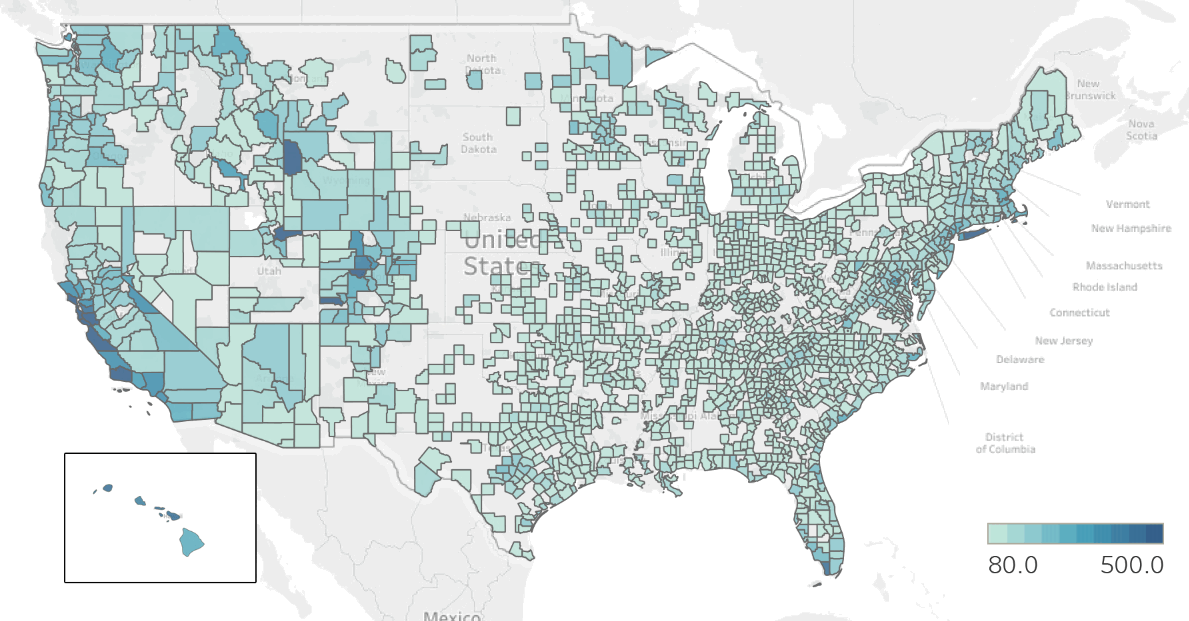
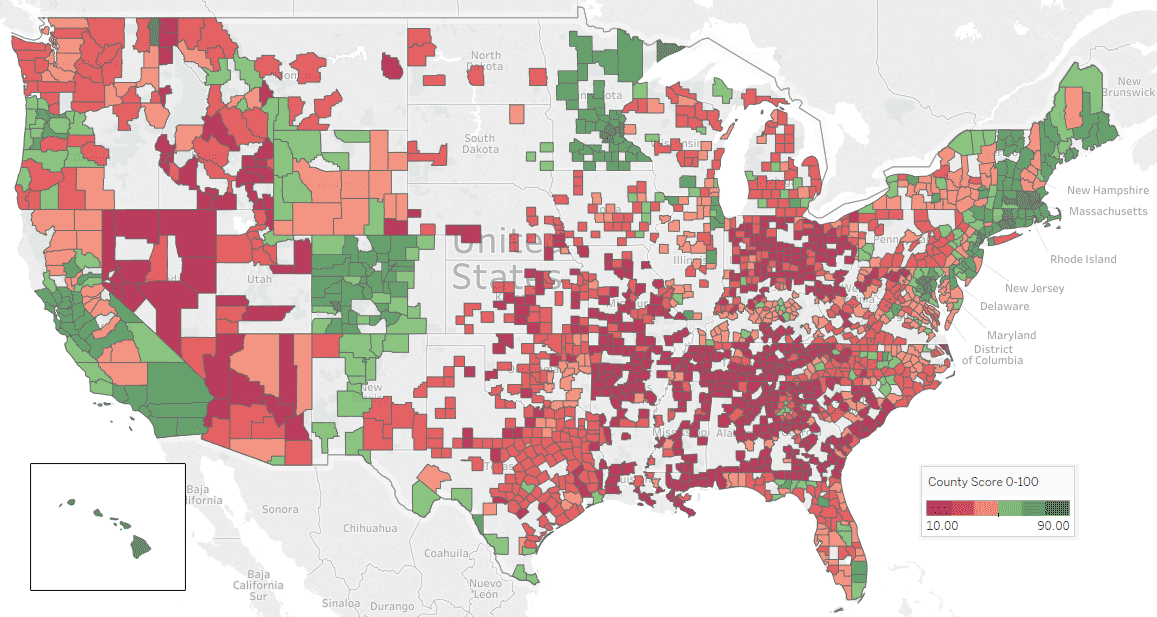
I followed the same scenario to find the number of above average school in each county. I'm aware that school districts are not the same as the boundary of counties but for now let's assume that's the case. Again I used a Python script to send 7,000 requests to a school ranking website downloading the count of above average (7+ out of 10) schools. Only 3,448 counties have good schools by this definition. To assign a fair score to each county, instead of averaging the number of schools for each city, I calculated the number of schools per 100 inhabitants under age of 18 years. Here is the result:

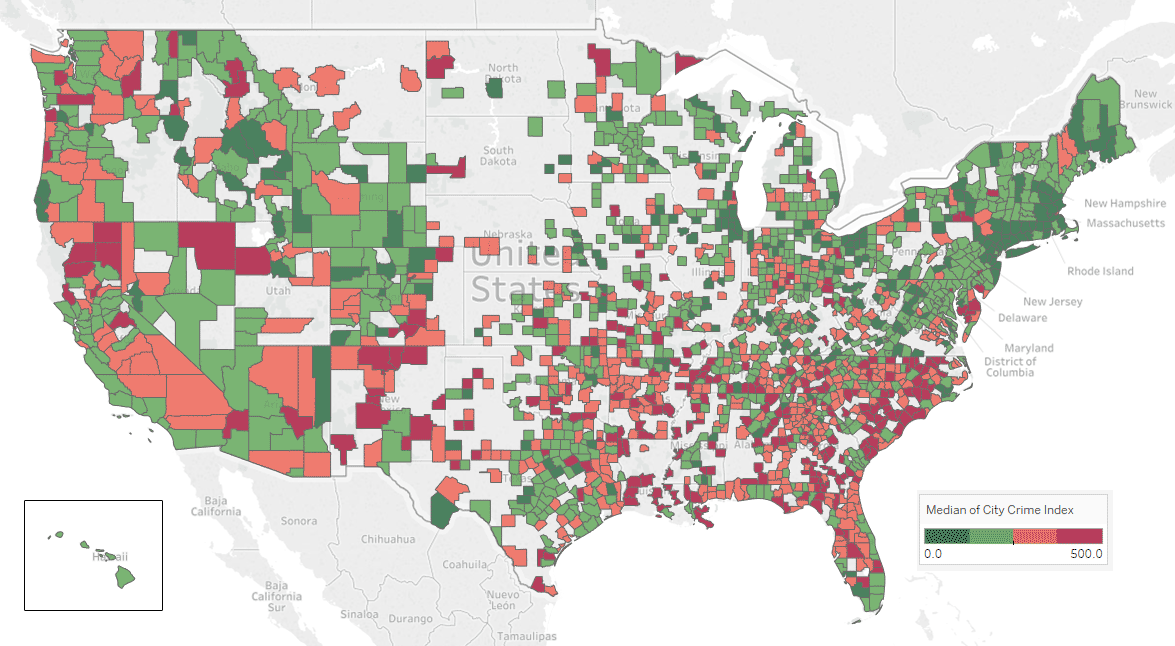
Crime Rates
I used FBI data for capturing crime rates. I should say the data is not in the best form to apply data analysis. First of all, it just includes metropolitan area and covers around 600 cities so I need to apply extensive imputation to cover to all 7,000 cities. This ended up generating inaccurate results for some cities. For example, in my final dataset Bethesda, MD has 360 violent crimes per 100,000 inhabitants, something I can confidently claim to be false based on my personal experiences in the area. In the future, I'll use more accurate data such as NeighborhoodScout.
The only trick that's worth mentioning here is that I used the following code to unpivot (stack) dash separate city names to rows.
df = df.drop(
 'area_name', axis=1).join(
     df.area_name.str.split('-', expand=True).stack().reset_index(
         drop=True, level=1).rename('area_name'))
Update 06/07/2017:
I managed to get crime statistics of 70% of cities from city-data.com. Now, the coverage map looks much better.
Political View and Other
For political view and demography, I found a wonderful dataset on Kaggle by Ben Hamner. I calculated the percentage of support for each major party for all counties based on the presidential primary results. The initial post on Kaggle also has valuable demographic data such as the percentage of non-white people which helped me to find more diverse areas. I also used Wikipedia's Table of U.S. state party statistics to include the voting data used to elect governors, State Senate, State House, etc. on the state level.
Speaking of state-level data, I also integrated education, healthcare, state tax, and state average temperature datasets in case one wants to include state-level data in the calculations.
After gathering data the calculation is rather simple. We just need to normalize each column using the min-max method, then multiply column weight, and finally sum the values. One issue here is that I'm not sure about the weight of each column, so in order to have a more flexible system, I created a dashboard using Javascript and applied the weighting using d3js. As the result, I can change the parameter way faster than changing the hard coded weights.
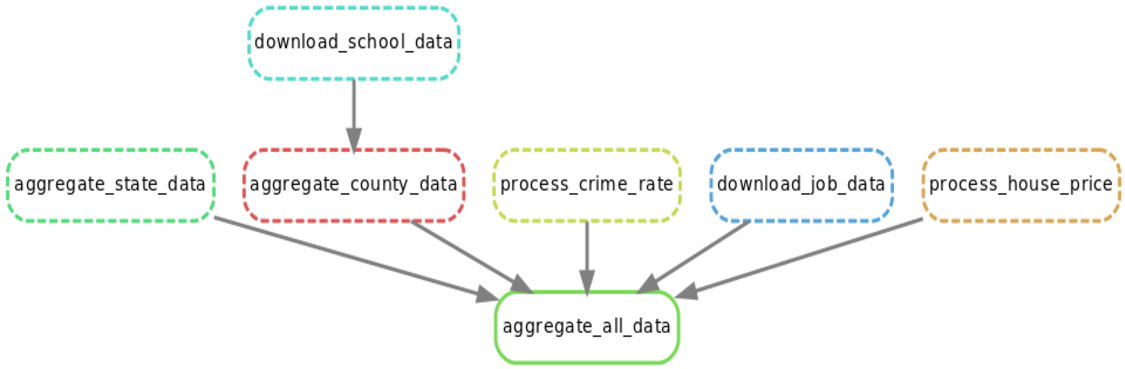
Another implementation detail that I would like to mention is that I used a workflow automation tool named 'Snakemake'. As the name suggest this tool is inspired by the legendary Make to help you run your data science pipeline more efficiently. When you have multiple scripts and data files instead of running the script one by one and passing the data file around, you can simply setup a Snakefile that does it all for you. These kinds of tools also gives you the luxury of running independent scripts in parallel. Snakemake is one of the simplest workflow automation tools so if you like to try more advanced features such as visual pipeline status, please try Luigi or Airflow. Heere is the workflow of my pipeline in DAG format:
The Result
Having a set of knobs to change and check the result is way more comfortable in comparison to hard coding each criterion and running a script each time you want to see the new result. So, by using Mobile jQuery I designed a web page so that you can set the priority of each factor and see the result of the ranking in a simple table. Interestingly on my first attempt, I got Columbia, MD as the winner which ranked first in other studies, such as Money magazine.
Next Step(s)
There is always there is room to improve any data mining project. Going forward, I need to improve the accuracy and precision of the data by expanding the coverage and finding more reliable sources; for example, crime data needs to be expanded as much as possible. Then, applying more advanced analytics and machine learning could be an interesting experience to study and extract relations between features of the dataset.


July 16, 2017
[…] the previous blog post, I tried to rank cities of United Stated based on the different type of data, Zillow housing […]
March 21, 2018
[…] as explained in this blog post, I used publicly available data to discover which cities in the United States are the […]