


Introduction
Shifts in technology, more specifically Information Technology (IT), have been changing everything around us. Big Data, as an example of shifts in technology, is taking the IT industry by storm and this impact is just not limited to the IT industry. Retail enterprises, for instance, have leveraged Big Data in many aspects of their business. In the retail supply chain, as part of the retail industry, 55 percent of companies utilize routinization of Big Data and 11 percent recently started using it. This means only 34 percent of companies in retail supply chain business have not yet adopted Big Data (Barratt, 2015). Samples like this motivated me to take a closer look at the retail industry to see how companies in this industry are using and affected by Big Data. I expect to see how Big Data attributes may change different aspects of an organization, such as leadership and structure.
What is Big Data?
Big Data is a broad term applying to a variety of concepts. This article mainly focuses on the core of Big Data, which is about the gathering and analytics of Data. I believe taking a look at the history of Data Storage and Data Processing would be helpful to understand Big Data better.
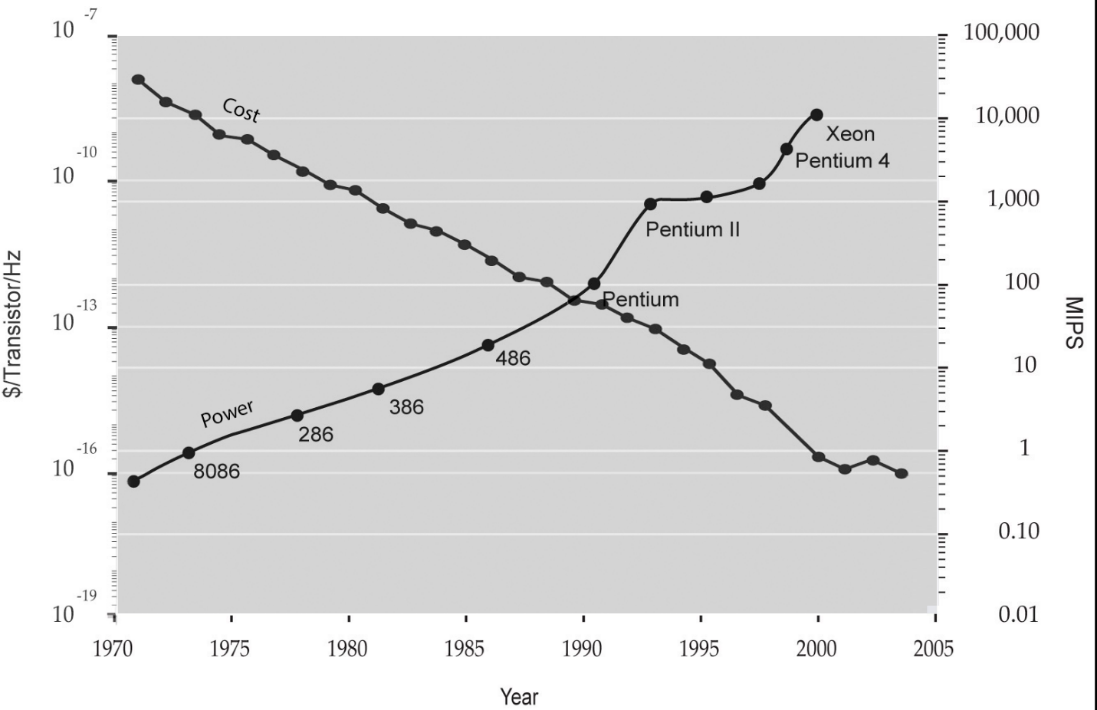
Data storage and processing tools and technics (aka Information Technology) have come a long way from when they used to be stored on a punch card to the present, where computers can handle petabytes of data in seconds. Saving time and money for government agencies and companies were the main incentive that led to this significant improvement. By using Herman Hollerith's application of punch card equipment, for instance, the Census Office saved $5 Million in processing costs. Previously, tabulating the census data required two to three years, compared with 7 to 8 years for the 1880 census. (Bohme, 1991). Companies such as IBM innovated new technologies and lowered the cost of computers to enhance electronic data processing. As a result, even small companies use computers to fulfill everyday transactions (French, 2008). Figure 1, shows how processing power and cost have been changing over time.
Beginning in the mid-60s, companies involved in data processing, for compatibility reasons, became interested in standardizing the methods of Data Definition and Data Manipulation. As a result, “Database Task Group” was founded and in 1969 the first draft of Data Definition Language (DDL) and Data Manipulation Language (DML) was born. The next significant milestone in classic data processing was in 1974 when IBM finished the first prototype of the Relational Database Management System (RDBMS), based on the groundbreaking research by Edgar Codd at the IBM research laboratory (Singh, 2011). It is interesting to know that RDBMS still is being used by millions of applications and websites all over the world, based on a study in 2014, RDBMS had more than 86% market share (Vaughan-Nichols, 2014).
RDBMS basically use structured data[1] but the emergence of Enterprise Content Management Systems (ECM)[2], and the Web in the early 90s, raised the necessity of handling data that does not have a predefined model, such as documents, web pages, audio files, image files, user comments, etc. (Nugent, 2013). In 1998, Merrill Lynch cited a rule of thumb that "somewhere around 80-90% of all potentially usable business information may originate in an unstructured form" (Shilakes, 1998). The situation resulted in the NoSQL movement, started in 1998, to handle unstructured data more efficiently. The term NoSQL was coined by Carlo Strozzi in 1998 (Lith, Adam, Mattson, Jakob 2010) and then reintroduced by Johan Oskarsson in 2009 to label the emergence of an increasing number of non-relational, distributed data stores (Evan, 2009).
While researchers and companies were busy increasing processing power and storage capacity something unlikely happened. Data population rates exceeded computational power, which is now commonly known as Data Explosion (Maney, 2014) or Curse of Big Data (Granville, 2013). With the introduction of the Internet of Things (IoT) and Smart Phones, things got worse and the situation still exists today. A report by Computer Sciences Corporation forecasts that enterprises all over the world have to deal with 38.5 Zettabytes[3] of data in the year 2020 (CSC, 2012). Creating data processing power to manage this amount of data means we probably will get buried under data centers by that time (Maney, 2014).
In the dramatic situation pictured above, Big Data came like a hero to rescue humankind from the evil of working with unruly data. At first, the term Big Data was used by Michael Cox and David Ellsworth in 1997 to describe the situation where the data is too big to fit the computer’s memory (Press, 2013). But, over time, the term applied to technologies related to handling an enormous amount of data in real time. The attributes of a Big Data system originally known as 3Vs (Laney, 2001) plus one more V which became more important in recent years (Walker, 2012) are the following:
- Volume: Big Data systems deal with a huge amount of data, such as Petabytes
- Variety: Big Data systems deal with structured and instructed data from various sources such as the databases in local corporations and Facebook comments.
- Velocity: Big Data systems come up with the results in real time.
- Veracity: The quality of captured data is very important for Big Data systems.
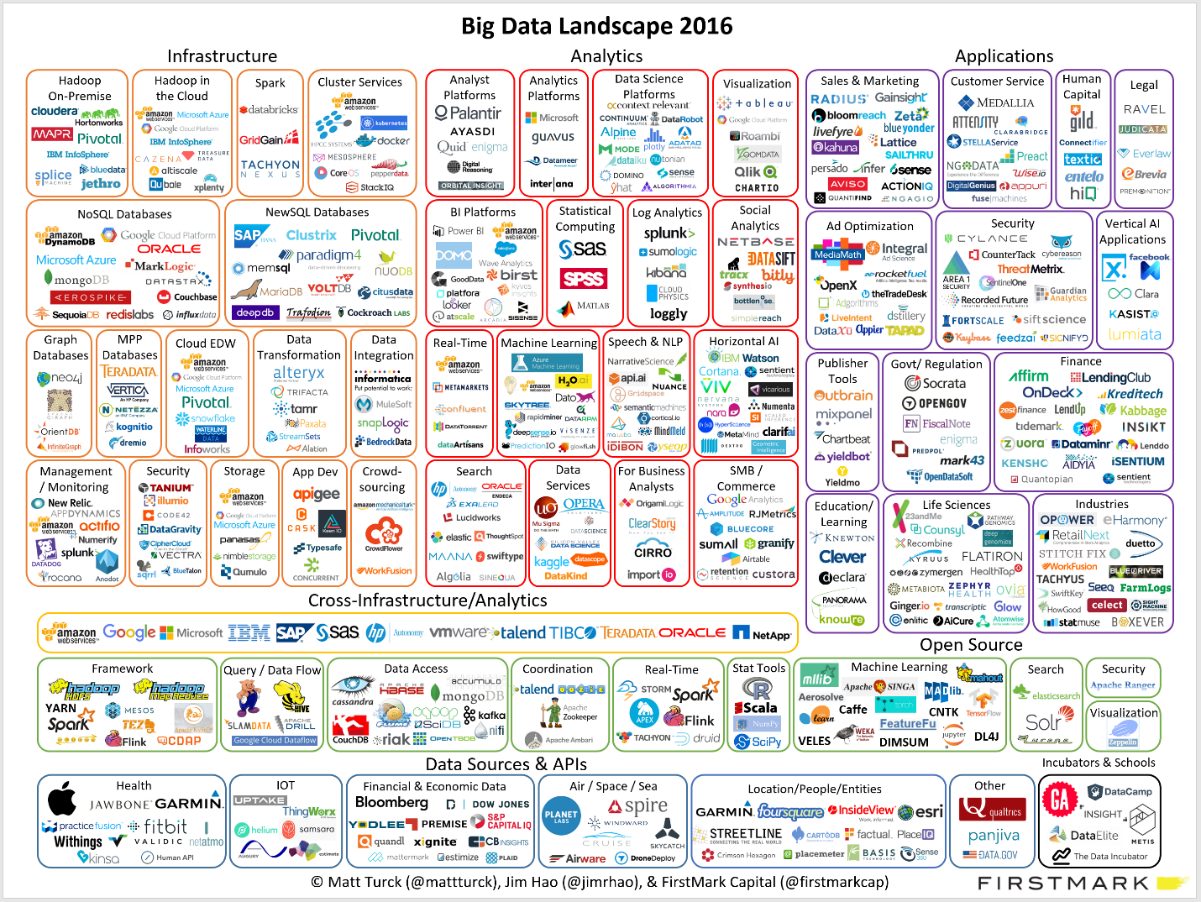
In other words, Big Data is the combination of technologies that give the right insights, at the right time, and based on the right data (Nugent, 2013). As you can see in the Figure 2, this bold promise convinced almost every big name in various industries to invest in Big Data.
Later in this article, it will be explained how big data is changing the way retailers deal with the problems of the digital age. But before that let us take a look at the history of Information Technology in the retail industry.
Retail and Information Technology
It is not necessary to take time to define what Retail is, people visit retailers almost every day- Walmart, Tesco, and Costco are among the most famous. In one sentence, retailers sell consumers goods and services to gain profit. As the result of the popularity, the Retail Market has a high amount of cash turnover. For instance, in 2013, according to Published Company Data and Planet Retail, top 10 retails in the world earned 1,294,698 million dollars and the net profit margin was 2.8%. With this astronomical revenue, it should be very important for retailers to minimize the costs to maximize their profit. So it is not a surprise that retails discovered Information Technology (IT) early in history:
- 1960-1980: During this time, retailers used information technology to first capture and collect data and then, get aggregated information. A sample question in this time period would be something along the lines of: “What were the average total revenues over the last five years?” (Rao, 1998)
- 1980s: As mentioned in the previous section, the innovation of the Relational Database Management System (RDBMS) was a huge boost for the data processing world. Such an innovation, along with several tech companies entering the IT field, like Oracle and Microsoft, enabled retailers to answer more meaningful questions about their business, such as “What were the unit sales in Georgia last April?” (Rao, 1998)
- 1990s: During this period, technologies such as multidimensional databases and data warehouses provide retailers with more analytical capabilities. Retailers, in that time, were able to run record level queries and answer questions like “What were unit sales in Georgia last September? Provide breakdowns for Atlanta” (Rao, 1998)
- 2000s: In the late 90s and still today, predictive data analysis, and more specifically, Data Mining are playing a major role in data processing and analysis. By leveraging several tools such as Neural Networks and Genetic Algorithms, Data Mining allowed retailers to predict customer behavior and answer questions related to the future (Rao, 1998; Omari, 2008), such as “What will the average total revenue be over the coming five years?”
As outlined above, data processing and analysis has helped retailers significantly to have a better understanding of the past, present, and future. In the next section, we will discuss the problems the retail industry is still facing and explore how the use of big data aims to address these problems.
In the part we will take a close look on how big data has changed the retail industry.
[1] Structured data refers to any data that reside in a fixed field within a record or file. This includes data contained in relational databases and spreadsheets. [webopedia.com/TERM/S/structured_data.html]
[2] Enterprise Content Management (ECM) is a formalized means of organizing and storing an organization's documents, and other content, that relates to the organization's processes. The term encompasses strategies, methods, and tools used throughout the lifecycle of content [wikipedia.org/wiki/Supply_chain_management]
[3] 1 Zettabyte = 1,000,000,000 Terabytes

September 19, 2018
[…] Part I of this blog post we discussed what big data is and how Big Data is changing industries. We start […]